
01 / Choose the view
Current is this run; All-Time is the longer view
Tap Current for the active UT Champs run: its record, remaining games, last match, xG charts, win/loss comparisons, and player contributions. Tap All Time to compare runs from the selected EA FC edition. In All-Time, choose UT Champs, Rivals, or Both modes before reading a trend.
Use Current to choose a change for your next few games. Use All-Time to ask whether the same issue appears across more than one run. A good run is useful context; it is not a promise that one stat caused the results.
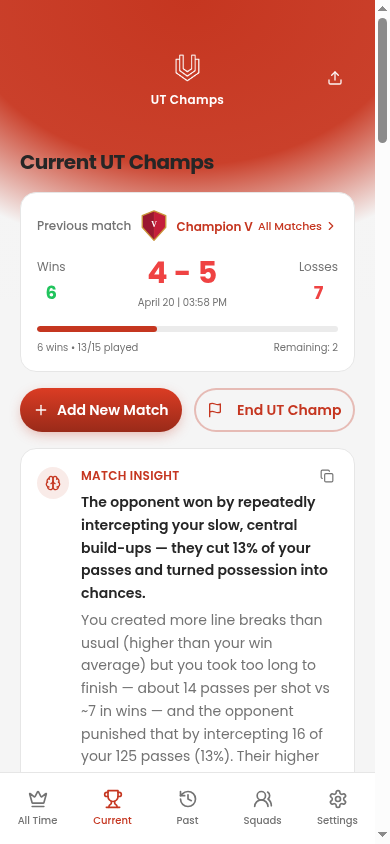
02 / Current
Read the Current dashboard from result to pattern
First check the record and how many games you have logged. Next, read the xG Data card: xG for is an estimate of chance quality you created, and xG against is the same for your opponent. Then open Detailed Stats and compare your wins with your losses. Switch to Opponent Stats if your own attack looks similar in both groups.
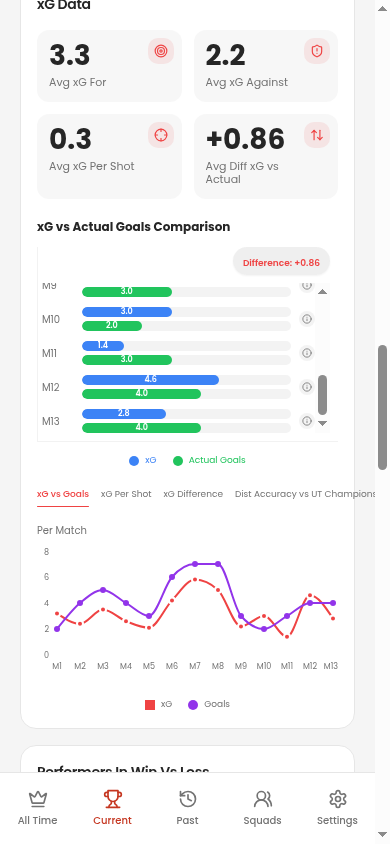 Current · xG
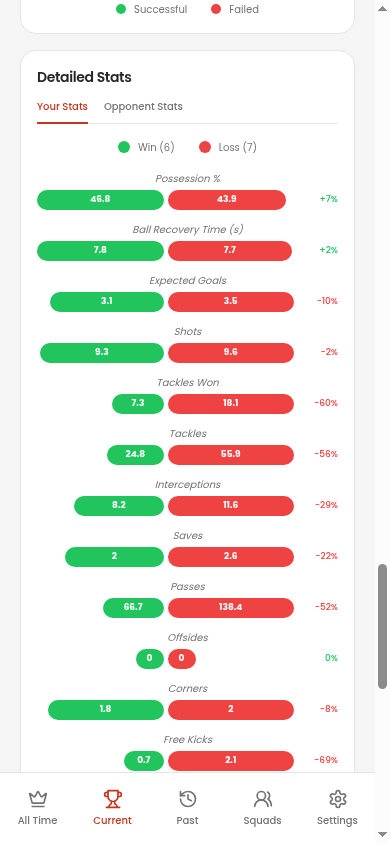 Current · win/loss
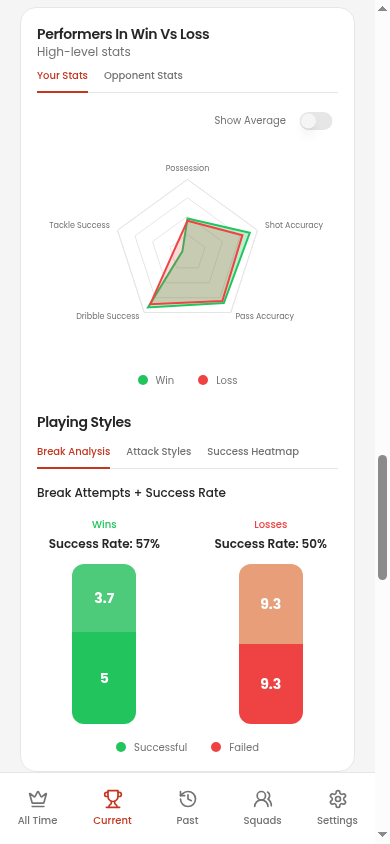 Current · styles
03 / Worked example
Use shots and xG together, not either one alone
The real Detailed Stats capture above shows rounded averages from six wins and seven losses. Divide xG by shots to estimate xG per shot, a rough way to compare the quality of chances taken.
| Result | Shots | xG | xG ÷ shots |
|---|---|---|---|
| Wins (6) | 9.3 | 3.1 | ≈ 0.33 |
| Losses (7) | 9.6 | 3.5 | ≈ 0.36 |
In this sample, the loss group did not create obviously fewer or weaker chances. The next useful check is the opponent's shots and xG, then a replay of the chances conceded. These ratios use rounded on-screen averages, so treat them as approximate. xG is an estimate, and a 13-game run cannot establish why any individual match ended as it did.
04 / All-Time
See whether the pattern survives another run
All-Time collects your matches across runs in the selected game edition. Its Key Metrics summarize games, wins and goals; Performance Overview shows the record by run; xG and style charts let you compare longer patterns. The filter matters: keep UT Champs selected when judging Weekend League progress, and inspect Rivals separately when the match context differs.
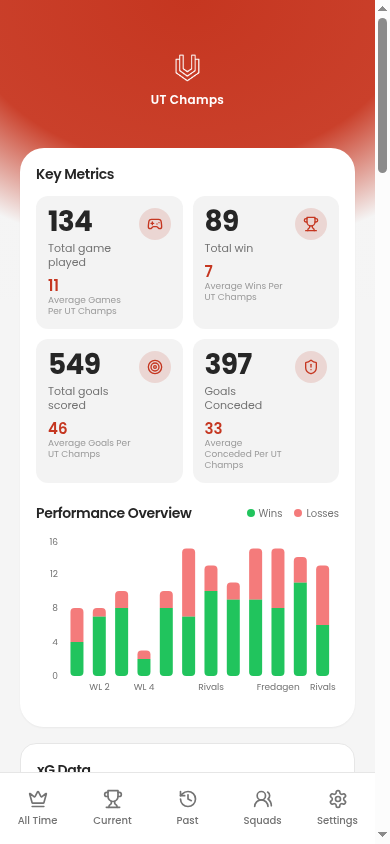 All-Time · runs
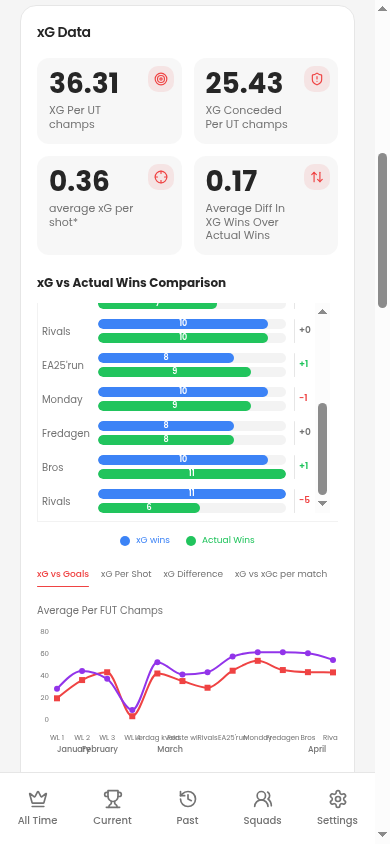 All-Time · xG
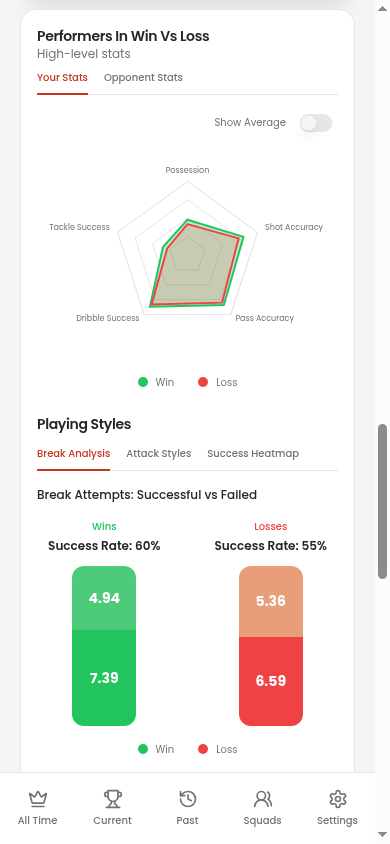 All-Time · patterns
Compare runs with a similar number of played matches. Check which stats were actually recorded and whether you changed mode or game edition. A higher goal total across a longer run does not necessarily mean better attacking play per match.
05 / Put it to use
Choose one test for the next three to five matches
- Find one repeated difference between wins and losses in Current.
- Check the opponent's side and a replay so you do not mistake correlation for a cause.
- Choose one action to practise, such as taking fewer tight-angle shots or protecting the middle after a turnover.
- Save the next three to five results with the same stats, then check Current again.
- At the end of the run, use All-Time to see whether the change appears across runs.
If you need to capture the stats first, follow the illustrated scanning guide. For an optional interpretation of a saved game, read how Match Insights work. The EA FC improvement plan has ideas to test on the pitch.
Start with a clean match scan